|
|
 |
|
|
|
Uintah PMEL Measurements
Contact persons: Tim Bates, tim.bates@noaa.gov; Trish Quinn, patricia.k.quinn@noaa.gov
Time Zone Note
UTC is used as the time zone for the standard time parameters in all of the ACF, IGOR and ICARTT files for the UBWOS project on this server. To conform to the request for using Mountain Standard Time, MST (UTC - 7 hours), a time parameter IgorTime_MST has been added to all the files. This is the IGOR time using MST. IGOR time is defined as the number of seconds since 00 hours on 1-Jan-1904.
1. Sampling
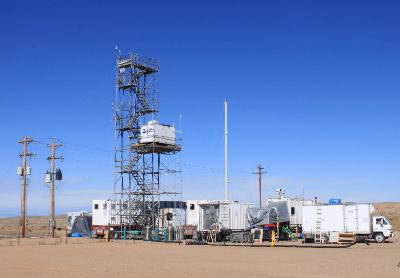
Aerosol particles were sampled 13 m above the ground through a mast that extended 9.1 m above the aerosol measurement container. The mast was capped with an inverted-bowl rain shield. Air was drawn down the 20 cm diameter mast at 1 m3 min-1. A 5 cm diameter 2.3 m long stainless-steel pipe extended into the base of the mast. The pipe was heated to 9.75 ± 0.68°C to dry the aerosol to a relative humidity (RH) of <25%. At the base of the mast, the flow through the stainless steel pipe was split into four 1.6 cm diameter stainless-steel tubes that were attached to four 2-stage multi-jet cascade impactors (Berner et al., 1979). A flow of 20 l min-1 provided 50% aerodynamic cutoff diameters, D50,aero, of 2.5 and 12.5 um. One impactor (PM 2.5 only) was used for organic and elemental carbon analysis. The second impactor was used for anion and cation analysis. The third impactor was used for gravimetric and trace element (XRF) analysis. The fourth impactor was used to provide a PM 2.5 size cut for the particle-into-liquid sampler (PILS), the nephelometer, and the Particle Soot Absorption Photometer (PSAP). An additional 0.63 cm port in the flow splitter was used to provide aerosol to a Scanning Mobility Particle Sizer (SMPS), an Aerodynamic Particle Sizer (APS), and a water-based condensation nucleus (CN) counter. Impactor sampling times ranged from 5 to 12 hours. Generally, one sample was collected during the day and one sample was collected between sunset and sunrise. The average temperature and RH in the sample line measured downstream of an impactor was 24.3 ± 1.9°C and 10.3 ± 3.9%, respectively.
Concentrations are reported as ug/m3 at STP (25C and 1 atm). Values below the detection limit are denoted with a -8888 in the .acf file or zero in the .itx and .ict files, missing data are denoted with a -999 in the .acf files, -9999 in the .ict files and NaN in the .itx files.
Berner et al., Sci. Total Environ., 13, 245 - 261, 1979.
2. OC/EC
A charcoal denuder was deployed upstream of the impactor used for organic carbon (OC) and elemental carbon (EC) sampling to remove gas phase organic species. The 32 cm long diffusion denuder contained 16 parallel strips (30 faces) of 20.3 cm x 3 cm carbon-impregnated glass fiber (CIG) filters (Whatman-10320163) separated by ~1.6 mm. The denuder cross-sectional area was 7.45 cm2. Two 47mm quartz fiber filters (Pall Gelman Sciences, #7202, 9.62 cm2 effective sample area) were used in series downstream of the 2.5 um impaction stage. The downstream filter was used as the sample blank. The quartz filters were baked prior to use at 550˚C for 12 hours. After sample collection, the filters were stored in Al foil lined (press-fitted) petri dishes in a freezer dedicated solely to these filters. The samples were returned to Seattle for analysis after the experiment.
Filter samples collected for OC and EC quantification were analyzed using a Sunset Laboratory thermal/optical analyzer. The instrument heated the sample converting evolved carbon to CO2 and then CH4 for analysis by a FID. Three temperature steps were used to evolve OC under O2-free conditions for quantification. The first step heated the filter to 230C; the second step heated the filter to 600C (AMS vaporizer temperature); and the final step heated the filter to 870C. After cooling the sample down to 550C, a He/O2 mixture was introduced and the sample was heated in four temperature steps to 910C to drive off EC. The transmission of light through the filter was measured to correct the observed EC for any OC that charred during the initial stages of heating. No correction was made for carbonate carbon so OC includes both organic and carbonate carbon. The percentage of carbonate carbon is unknown.
3. Inorganic Cations & Anions (impactor sampling)
One two-stage multi-jet cascade impactor was used to determine the sub 2.5 um and 2.5-12.5 um diameter concentrations of Cl-, Br-, NO3-, SO4=, oxalate (Ox-), Na+, NH4+, K+, Mg+2, and Ca+2. The impaction stage at the inlet of the impactor was coated with silicone grease to prevent the bounce of larger particles onto the downstream stages. Tedlar films were used as the collection substrate in the impaction stage and a Millipore Fluoropore filter (1.0-um pore size) was used for the backup filter. Films were cleaned in an ultrasonic bath in 10% H2O2 for 30 min, rinsed in distilled, deionized water, and dried in an NH3- and SO2-free glove box. After sampling, filters and films were wetted with 1 mL of spectral grade methanol. An additional 5 mLs of distilled deionized water were added to the solution and the substrates were extracted by sonicating for 30 min. The extracts were analyzed by ion chromatography [Quinn et al., 2000]. All handling of the substrates was done in the glove box. Blank levels were determined by loading an impactor with substrates but not drawing any air through it. Br- concentrations were all below detection limit (0.005 ug/m3).
NH4NO3 is often a major component in continental aerosols. NH4NO3 is volatile and is not efficiently collected on filters in an impactor. The NO3- and NH4+ concentrations in the data base for impactor cation/anion samples include the NO3- and NH4+ concentrations measured in the PILS samples averaged over the impactor sampling times. This gives a much truer representation of the actual NO3- and NH4+ concentrations.
Quinn et al., J. Geophys. Res., 105, 6785 - 6805, 2000.
4. Inorganic Cations & Anions (PILS sampling)
A particle-into-liquid sampler (PILS) (Weber et al., 2001, Orsini et al, 2003) and fraction collector were used to collect aerosols for cation and anion analysis. Fifteen l min-1 of sample flow were taken downstream of one of the two-stage impactors and routed through two URG denuders. One denuder was coated with sodium carbonate for the removal of gas phase acids and the other with citric acid to remove gas phase bases. The flow then entered the PILS to concentrate the aerosol particles. The impaction rinse flow was adjusted to obtain one sample vial (0.75 ml) every 30 minutes. The samples were run the following day on the same ion chromatograph used for the impactor cation/anion samples. Blanks were collected each day by valving a hepa filter into the sample stream. Sulfate concentrations collected with the PILS correlated well with the samples collected with the impactor (r2=0.94). The slope of the regression, however, was 0.5. The PILS samples reported in the data base have been corrected based on this regression assuming that all ions had the same collection efficiency. The advantage of the PILS system is a higher time resolution and a better collection efficiency of NH4NO3. The disadvantage is the higher ion detection limit and lower collection efficiency for ions other than NH4+ and NO3-.
Weber, R.J., D. Orsini, Y. Daun, Y.-N. Lee, P.J. Klotz, and F. Brechtel, Aerosol. Sci. Technol., 35, 718-727, 2001.
Orisini, D.A. et al., Atmos. Environ., 37, 1243 - 1259, 2003.
5. Gravimetric mass and trace elements
One two-stage multi-jet cascade impactor was used to determine the sub 2.5 um and 2.5-12.5 um diameter gravimetric aerosol mass. The data are reported as PM 2.5 and PM 12.5 (sum of the two weights). Millipore Fluoropore films and Teflo filters were used in the impactor. Films were cleaned in an ultrasonic bath in 10% H2O2 for 30 min, rinsed in distilled, deionized water, and dried in an NH3- and SO2-free glove box.
Films and filters were weighed at PMEL with a Cahn Model 29 and Sartorius model SE2 balance, respectively. The balances are housed in a glove box kept at a humidity of 65 ± 4%. The resulting mass concentrations from the gravimetric analysis include the water mass that is associated with the aerosol at 65% RH.
The glove box was continually purged with room air that had passed through a scrubber of activated charcoal, potassium carbonate, and citric acid to remove gas phase organics, acids, and ammonia. Static charging, which can result in balance instabilities, was minimized by coating the walls of the glove box with a static dissipative polymer (Tech Spray, Inc.), placing an anti-static mat on the glove box floor, using anti-static gloves while handling the substrates, and exposing the substrates to a 210Po source to dissipate any charge that had built up on the substrates. Before and after sample collection, substrates were stored double-bagged with the outer bag containing citric acid to prevent absorption of gas phase ammonia. More details of the weighing procedure can be found in Quinn and Coffman [1998].
After post-experiment weighing, the Teflo filter was used to determine the PM 2.5 mass of Al, Si, Ca, Ti, and Fe using thin-film x-ray primary and secondary emission spectrometry (Feely et al, 1991; Feely et al., 1998).
Quinn, P.K. and D.J. Coffman, J. Geophys. Res, 103:16575-16596, 1998.
Feely et al., Geophys. Monogr. Ser., vol. 63, AGU, Washington, DC, 251 - 257, 1991.
Feely et al., Deep Sea Res., 45, 2637 - 2664, 1998.
6. Condensation Nuclei (CN)
Total particle number concentration (CN) was measured with a water based CN counter (TSI 3785). This instrument counts all particles with diameters greater than 5 nm. The data reported in the data base are one minute averaged data. One second data are available on request.
7. Aerosol in-situ Light Scattering and Absorption, Scattering and Absorption Ångström Exponents, and Single Scattering Albedo
A TSI integrating nephelometer (Model 3563) was used to measure integrated total aerosol light scattering at wavelengths of 450, 550, and 700nm (Anderson et al, 1996; Anderson and Ogren, 1998). A Radiance Research Particle Soot Absorption Photometers were used to measure aerosol light absorption at 467, 530, and 660nm (Bond et al., 1999; Virkkula et al., 2005). Both instruments were downstream of a two stage impactor that provided a 2.5 um diameter size cut.
Data from both systems were collected and processed at 1 sec resolution but are reported as 60-second averages. Data from each instrument are corrected and adjusted as described below, allowing for derivation of extensive parameters (light scattering and absorption) and intensive parameters (single scatter albedo, Angstrom exponent). Light absorption is box-car averaged by the instrument over a window 10-seconds wide.
For all parameters, the bad value code is "NaN" (-9999 in the .acf fles). Intensive parameters are set to NaN when the extensive properties used in their calculation fell below the measurement noise threshold. Both extensive and intensive properties are set to NaN (-9999) during certain events, such as during filter changes, instrument calibration, obvious instrument failure etc. Negative values of absorption might occur during periods of absorption signals near or in the range of the instrument noise, and are partly shifted into the negative range due to scattering correction.
EXTENSIVE PARAMETERS
Data from the TSI integrating nephelometer were processed as follows:
Span gas (air and CO2) calibrations were made before the field campaign using the standard TSI program. During the campaign, zero (particle free air at ambient water vapor conc.) and CO2 span checks were made at three to four day intervals. The resulting zero offset and span factors were applied to the data.
The TSI nephelometer measures integrated light scattering into 7-170 degrees. To derive total scatter (0-180degrees) angular truncation correction factors were applied as recommended by Anderson and Ogren (1998).
Total light scattering was adjusted to STP (1013.2 hPa, 273.2 K).
Data from the Radiance Research Particle Soot Absorption Photometer were processed as follows:
Reported values of light absorption were corrected for spot size, flow rate, artifact response to scattering, and error in the manufacturer's calibration, all given by Bond et al. (1999). Except the spot size, all corrections were made after data collection, i.e. they are not integrated into the PSAP firmware. However, the PSAP was flow-calibrated prior to the campaign, and a flow correction was applied based on routine flow checks during the cruise.
Light absorption was adjusted to STP
INTENSIVE PARAMETERS
The Ångström exponent for scattering at (450,550,700nm),
A_Blue = -log(Bs/Gs)/log(450/550)
A_Green = -log(Bs/Rs)/log(450/700)
A_Red = -log(Gs/Rs)/log(550/700)
where Bs, Gs and Rs are light scattering values that apply to 450, 550 and 700 nm, respectively and where these values have been smoothed by averaging over a 30-sec wide window.
The Ångström exponent for absorption at (467,530,660nm),
A_Blue = -log(Ba/Ga)/log(467/530)
A_Green = -log(Bs/Rs)/log(467/660)
A_Red = -log(Gs/Rs)/log(530/660)
where Ba, Ga and Ra are light absorption values that apply to 467, 530 and 660 nm, respectively and where these values have been smoothed by averaging over a 30-sec wide window.
The single scatter albedo of the sub- 2.5 micron aerosol was calculated as follows:
SSA = Neph_scat / (Neph_scat + PSAP_abs)
where light absorption values and scattering have been averaged over 60 seconds. SSA is given for 532nm, i.e. the nephelometer data was wavelength-shifted to match the PSAP wavelength using the nephelometer based Ångström exponent.
Anderson, T.L., D.S. Covert, S.F. Marshall, M.L. Laucks, R.J. Charlson, A.P. Waggoner, J.A. Ogren, R. Caldow, R. Holm, F. Quant, G. Sem, A. Wiedensohler, N.A. Ahlquist, and T.S. Bates, Performance characteristics of a high-sensitivity, three-wavelength, total scatter/backscatter nephelometer, J. Atmos. Oceanic Technol., 13, 967-986, 1996.
Anderson, T.L., and J.A. Ogren, Determining aerosol radiatve properties using the TSI 3563 integrating nephelometer, Aerosol Sci. Technol., 29, 57-69, 1998.
Bond, T.C., T.L. Anderson, and D. Campbell, Calibration and intercomparison of filter-based measurements of visible light absorption by aerosols, Aerosol Sci. Technol., 30, 582-600, 1999.
Virkkula, A., N.C. Ahquist, D.S. Covert, P.J. Sheridan, W.P. Arnott, and J.A. Ogren, A three-wavelength optical extinction cell for measuring aerosol light extinction and its application to determining absorption coefficient, Aerosol Sci. Technol., 39,52-67, 2005.
Virkkula, A., N.C. Ahquist, D.S. Covert, W.P. Arnott, P.J. Sheridan, P.K. Quinn, and D.J. Coffman, Modification, calibration and a field test of an instrument for measuring light absorption by particles, Aerosol Sci. Technol., 39, 68-83, 2005.
8. Aerosol Number Size Distribution
The aerosol number size distribution was measured with a Scanning Mobility Particle Sizer (SMPS, TSI 3080 coupled to a TSI 3010 CN counter) and an Aerodynamic Particle Sizer (APS, TSI 3321). The SMPS was operated with a sheath air flow of 5 L/min and a sample flow of 1 L/min. The instrument counted particles between 20 and 500 nm geometric diameter. The APS was located directly below the mast. The inlet to the APS was vertical and its sample withdrawn isokinetically from the larger flow to the SMPS. The APS data were collected in 34 size bins with aerodynamic diameters ranging from 0.7 to 10.37 µm. Number size distributions were collected every 5 minutes.
The v0 data are given in two file types: DMPS size distributions where the sizes are geometric diameters and APS size distributions where the sizes are aerodynamic diameters. All data were filtered to eliminate periods of calibration and instrument malfunction. The value of -999 is assigned to any period without data. Data are reported in units of dN/dlog(base 10)Dp (cm-3) at an RH of <25%.
9. Aerosol Optical Depth
Aerosol optical depth was measured with a 5 channel handheld Microtops sunphotometer (Solar Light Co.) The instrument (SN 3803) measures at wavelengths of 380, 440, 500, 675, and 870 nm. The full angular field of view for the Microtops is 2.5 deg. The instruments have built in pressure and temperature sensors and were operated with a GPS connection to obtain position and time of the measurements. Raw signal voltages were converted to aerosol optical depths by correcting for Rayleigh scattering [Penndorf, 1957], ozone optical depth, and an air mass that accounts for the Earth's curvature [Kasten and Young, 1989]. The sunphotometer was calibrated at NASA-Goddard during the summer 2011 and again at the end of UWBOS.
Measurements followed the protocol of Knobelspiesse et al. [2003]. The scan length was set to 20 so that 20 measurements are obtained during each "shot". The largest voltage of the 20 measurements is recorded which corresponds to the lowest AOD. This approach helps to eliminate erroneous measurements that result from pointing errors. After the experiment, a post processing algorithm was applied. This algorithimm calculates a coefficient of variation for each measurement equal to the sample standard deviation divided by the sample mean. If the CoV > than 0.05, the highest AOD is removed and CoV is recalculated. This procedure is repeated until all points "pass". The uncertainty of the Microtops is esimated to be +/- 0.015 AOD.
Kasten, F. and A. T. Young, Revised optical air mass tables and approximation formula, Applied Optics, 28, 4735 - 4738, 1989.
Knobelspiesse, K.D. et al., Sun-pointing-error correction for sea deployment of the Microptops II handheld sun photometer, J. Atmos. Ocean. Technol., 20, 767, 2003.
Penndorf, R. , Tables of refractive index for standard air and the Rayleigh scattering coefficient for the spectral region between 0.2 and 20 um and their application to atmospheric optics, J. Opt. Soc. America, 47, 176 - 182, 1957.
10. Meteorological Parameters
Atmospheric temperature, RH, pressure, and wind speed and direction were measured with the PMEL Vaisala WXT520 Met sensor mounted on the ESRL tower 12 m above ground level.
U.S.Dept of Commerce / NOAA / OAR / PMEL / Atmospheric Chemistry