Radiosonde Data for: WACS2 - 2014
|
|
-
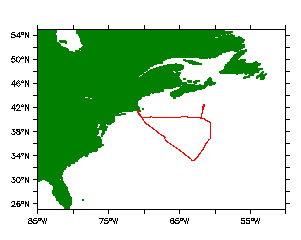
VESSEL: R/V Knorr
-
DEPARTED: Woods Hole, Massachusetts on 20 May, 2014
-
ARRIVED: Woods Hole, Massachusetts on 05 June, 2014
-
Link to more WACS2 pages
|
 |
The radiosonde data for CalNex on the R/V Atlantis
were collected with an iMet receiver using iMet-1 radiosondes provided by the Navel Postgraduate School.
These sondes directly measured temperature, pressure and relative
humidity. By tracking the position of the sondes from GPS signals, the
sondes horizontal position was measured from which the horizontal wind
speed were calculated.
A primary objective of the radiosonde program was to get detailed profiles from the boundary layer, and to accomplish that the balloons were given a calibrated leak, so that the ascent rate would slow down and the ultimate height would be 4 to 6 km, before the balloon would descend and give a second profile. The data available here are from the ascent portion of each flight.
The data files can be accessed here (click on "Download Sonde Data" above)
The raw data files have data at 1 second intervals during the sounding,
with the typical assent rates, this gives data points about every 2-5
meters. For plotting these data were interpolated onto a standard 50
meter altitude grid.
Radiosonde Wind Vectors: In all plots winds speeds are in
m/s. The horizontal wind vectors are plotted with arrows the whose
length is proportional to the wind speed. The length of a standard wind
vector of 20 m/s is shown at the bottom of each plot. Arrows pointing
down indicate wind from the north, Arrows pointing right indicate wind
from the west.
U.S.Dept of Commerce /
NOAA /
OAR /
PMEL /
Atmospheric Chemistry