Radiosonde Data for: Aerosols99-INDOEX
|
|
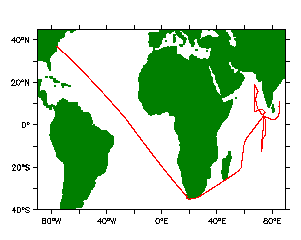
- VESSEL: R/V RONALD H. BROWN
- DEPARTED: Norfolk, Virginia on 14 January 1999
- VIA
- Cape Town, South Africa, 8-11 February
- Mauritius, 20-22 February
- Male, Maldives 1-4 March
- Male, Maldives 23-26 March
- ARRIVED: Male, Maldives on 30 March 1999
- link to more
Aerosols99-INDOEX pages
|
 |
The radiosonde data for the Aerosols99, INDOEX, and NURUR99 the NOAA R/V Ronald H. Brown were collected with a Vaisala receiver using
Vaisala RS-80 GPS radiosondes. These sondes directly measured
temperature, pressure and relative humidity. By tracking the position of the
sondes from GPS signals, the sondes horizontal position was measured from
which the horizontal wind speed were calculated.
Radiosondes were launched at synoptic times and the data were forwarded to
the US Weather service, so that the data were incorporated in the operational
forecasts as well as the gridded data archives. The raw data files have data at
10 second intervals during the sounding, with the typical assent rates, this gives
data points every 30 to 50 meters. For plotting these data were interpolated onto
a standard 125m altitude grid.
Radiosonde Wind Vectors: In all plots winds speeds are in m/s. The horizontal wind vectors are plotted
with arrows the whose length is proportional to the wind speed. The length of a standard wind vector of 20 m/s is shown at the bottom of each plot. Arrows pointing down indicate wind from the north, Arrows pointing right indicate wind from the west.
U.S.Dept of Commerce /
NOAA /
OAR /
PMEL /
Atmospheric Chemistry