|
 |
|
|
WACS RV Ronald H. Brown Aerosol Number size
distribution (Covert/Bates)
RV Ronald H. Brown
Aerosol Number-Size Distributions, 20 nm to 10 µm diameter
Version 0
PI contact information:
Timothy S Bates
OCRD
NOAA/PMEL
7600 Sand Point Way NE
Seattle, WA 98115
USA
Phone: 206-526-6248
Fax: 206-526-6744
E-Mail Address: tim.bates@noaa.gov
Or
David S Covert
University of Washington
Department of Atmospheric Science
Box 354235
Seattle, WA 98195
USA
206-685 7461
E-Mail Address:
dcovert@u.washington.edu
Or
Derek Coffman
NOAA/PMEL
7600 Sand Point Way NE
Seattle, WA 98115
USA
206-526-6574
206-526-6790
E-Mail Address:
derek.coffman@noaa.gov
The goal of this cruise was to measure nascent ocean derived aerosols. The Sea Sweep (Bates et al., 2012) was deployed at two stations during the cruise. The Sea Sweep consists of a frame of stainless steel (ss) flatbar 0.61 m wide, 0.91 m long, and 0.91 m high. The upper 0.15 m (bow and stern) and 0.46 m (port and starboard sides) of the frame are covered with ss sheet metal. The top is enclosed with ss sheet metal hood in a cone shape extending 0.3 m above the frame. The Sea Sweep frame is supported by two inflatable pontoon floats (1000 Denier Reinforced) 3 m long attached to aluminum tubing. The frame was adjusted in the pontoons so that the opening at the bow and stern was 1.0 cm above the water under calm conditions.
Three hoses are attached to the Sea Sweep cone top. One hose (1.3 cm ID Pliovic ™ reinforced (braided)) provides compressed air at a flow of 50 L min-1 to two ss diffusion stones (2 um porosity, 2.54 cm diameter, 24 cm long). The diffusion stones are horizontally mounted on the bottom of the Sea Sweep frame 0.75 m below the sea surface. A second hose (5.1 cm ID NutriFLEX Pliovic™) provides a laminar flow air curtain directed downward at the bow and stern ends of the frame. A blower is used to produce a flow of 2 m3 min-1 of particle-free air (charcoal and hepa filtered) to form this curtain. The curtain and side walls prevent ambient air from entering the Sea Sweep. The curtain provides an outward flow of about 1 m3 min-1 (1 m sec-1 face velocity) and an equal dilution flow to the bubbled air in the enclosed space under the hood. The third hose (5.1 cm ID NutriFLEX Pliovic™) brings 1 m3 min-1 of Sea Sweep “sample” air to the PMEL aerosol sampling mast 18 m above the sea surface. This is the same mast and flow rate used during ambient air sampling. The transmission efficiency of the PMEL sampling mast for particles with aerodynamic diameters less than 6.5 um (the largest size tested) is greater than 95% [Bates et al., 2002]. To check for particle losses, simultaneous measurements of the aerosol number size distribution resulting from bubbled seawater were made at the top of the Sea Sweep cone and at the base of the sampling mast with two Aerodynamic Particle Sizers (APS). These measurements showed no measurable loss of particles in either the hose or the mast.
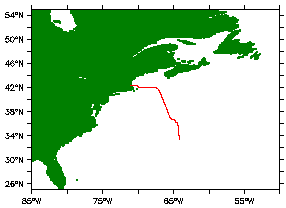
The Sea Sweep was deployed off the port bow of the RV Brown during WACS. The ship was positioned with the wind off the starboard bow and steamed slowly (0.2 m sec-1) forward during sampling to ensure a continual renewal of ocean surface water. The forward motion was relative to the current. During some deployments, the ship steamed slowly backwards to keep the water flow under Sea Sweep at 0.2 m sec-1. The ship motion was adjusted visually to keep some bubbles trailing behind Sea Sweep while most of the bubbles were captured in the hood. The ship blocked the true wind. During Sea Sweep sampling the aerosol sampling mast and instruments sampled Sea Sweep so there were no ambient aerosol measurements. Ambient measurements were made before station 1, between stations, and after station 2.
Bates, T.S., P.K. Quinn, A.A. Frossard, L.M. Russell, J. Hakala, T. Petäjä, M. Kulmala, D.S. Covert, C.D. Cappa, S.-M. Li, K.L. Hayden, I. Nuaaman, R. McLaren, P. Massoli, M.R. Canagaratna, T.B. Onasch, D. Sueper, D.R. Worsnop, and W.C. Keene, Measurements of ocean derived aerosol off the coast of California, J. Geophys. Res., 117, D00V15, doi:10.1029.2912JD017588, 2012.
Short Description:
The data files contain particle number-size distribution measured onboard the RV
RH Brown during WACS. These are measured by an integrated system of Aitken-DMPS,
Accumulation-DMPS and APS instrumentation and presented as two files, one from
the APS and one from the dual DMPS. The two data files represent DMPS scans and
APS averages over 5 minute intervals defined in the data file. The measurement
RH was 60% in the DMPSs. The RH in the APS was likely less than this due to
internal heating but could only be estimated. However, modifications were made
to the APS in 2002 to address the internal heating problem.
Data were inverted, edited, and analyzed by the PIs at PMEL.
Keywords: number concentration, number-size distribution, ultrafine differential mobility particle sizer, differential mobility particle sizer, aerodynamic particle sizer, UDMPS, DMPS, APS, relative humidity
Full Description of data set:
DOY:
DOY is decimal day of year such that DOY 1.5 is 12 noon UTC on 1 January. The
DOY values are the start time of the scan period.
Particle number-size distributions, [N(Dp)], aboard the RV RH Brown:
Aerosol particles were sampled at 18 m above sea level through a heated mast.
The mast extended 5 m above and forward of the aerosol measurement container.
The inlet was a rotating cone-shaped nozzle that was automatically positioned
into the relative wind. Air was pulled through this 5 cm diameter inlet nozzle
at 1 m3 min-1 and down the 20 cm inner diameter mast. The lowest 1.5 m of the
mast was heated to reduce the relative humidity (RH) to a value of not less than
60% and partially dry the aerosol. Twenty one 1.6 cm inner diameter conductive
tubes extending into this heated zone were used to subsample the main air flow
for the various aerosol instruments at flows of 30 l min-1.
One of the 21 1.6 cm diameter tubes was used to supply ambient air to a short differential mobility particle sizer (Aitken-DMPS) and a medium differential mobility particle sizer (Accumulation-DMPS). The two DMPSs were located in a temperature-controlled box at the base of the mast. The temperature was controlled such that the RH of the sample stream was maintained at 60% RH. The Aitken-DMPS was a University of Vienna (Reischle) short column instrument connected to a TSI 3760A particle counter operating with a positive center rod voltage to sample particles with a negative charge. Data were collected in 10 size bins from 20 to 200 nm diameter. The Aitken-DMPS operated with an aerosol flow rate of 1 L/min and a sheath air flow rate of 10 L/min. The Accumulation-DMPS was a University of Vienna (Reischle) medium column connected to a TSI 3760A particle counter operating with a positive center rod voltage to sample particles with a negative charge. Data were collected in 7 size bins from 200 to 800 nm diameter. The Accumulation-DMPS operated with an aerosol flow rate of 0.5 L/min and a sheath air flow rate of 5 L/min. The relative humidity of the sheath air for both DMPS was controlled resulting in a measurement RH in the DMPSs of approximately 60%. With this RH control the aerosol should not have effluoresced if it was hydrated in the atmosphere.
Mobility distributions were collected every 5-minutes from a mobility scan that started at even 5 minute intervals and lasted ca. 4.75 minutes.
The mobility distributions from the Aitken-DMPS, Accumulation-DMPS were inverted to a number distribution by assuming a Fuchs-Boltzman charge distribution resulted from the Kr85 charge neutralizer (Stratman, F. and A. Wiedensohler, 1997). The overlapping channels between the two instruments were eliminated in the inversion. The data were corrected for diffusional losses and size dependent counting efficiencies based on pre-ACE-2 intercalibration exercises at IfT.
The same 1.6 cm diameter tube was used to supply ambient air to the APS (TSI 3321) located in the lower temperature controlled box at the base of the mast. The temperature was controlled to maintain the RH of the aerosol sample stream at 60%.
The APS data reported here are in 34 size bins with the nominal manufacturers aerodynamic diameters ranging from 0.96 to 10.37 µm. Data are reported in aerodynamic diameter (micrometers) in units of dN/dlogDp (cm-3) at an RH of 60%. Additionally, modifications were made to the APS to account for the internal heating of the sample in the APS by its sheath flow and waste heat, which could reduce the measurement RH below 60% RH. First, the sheath flow was conditioned outside the instrument case before reintroduction into the sheath and acceleration nozzle. Second, the inlet tube was insulated to reduce heating at that point. While the temperature at the APS's sensing volume was not measured during sampling, laboratory testing prior to the cruise showed a significant reduction in the internal heating. Before the modifications, the differential temperature between the inlet and the sensing volume was about 3ºC, but after the modifications, the same differential temperature was reduced to less than 1ºC.
All data were filtered to eliminate periods of calibration and instrument malfunction. The value of -999 is assigned to any period without data.
The v0 data are given in two file types: DMPS size distributions where the sizes are geometric diameters and APS size distributions where the sizes are aerodynamic diameters. Additionally, the data have been separated into two sampling regimes: ambient and seasweep. The seasweep files contain data taken while on station and sampling from the seasweep and are denoted with "SeaSweep".
Format: comma-delimited ASCII. DOY (Julian Decimal Date) (UTC) followed by the dmps, aps size bins as described above. The first two rows of data contain the bin numbers and the midpoint diameters in micrometers of each bin, respectively.
References:
Stratman, F. and A. Wiedensohler. A new data inversion algorithm for DMPS
measurements. J. Aerosol Sci., 27, 339-340, 1997.
Data can be downloaded in a comma delimited format (.csv).
U.S.Dept of Commerce / NOAA / OAR / PMEL / Atmospheric Chemistry