|
|
 |
|
|
|
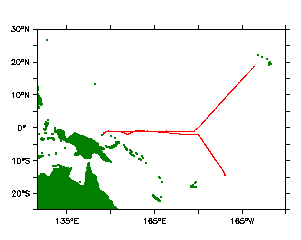
Latitude, Longitude
The ships position was recorded on the PMEL data logger from the PMEL Trimbal GPS unit. The latitude and longitude are measurements at each even 30 minute point with no averaging. For those times when there were no data at the 30 minute point, a point was taken from the Discoverer's SCS data system file. Units are decimal degrees north for latitude and decimal degrees east for longitude (200 degrees east = 160 degrees west).
Wind speed and direction were measured with the PMEL Qualimetrics anemometer and the Ship's RM Young anemometer. The PMEL anemometer was mounted above the top of the rain/seaspray shelter at the top of aerosol/gas sampling mast. The location of the PMEL anemometer as chosen primarily to select the times when the sampling mast was in the 'clean' sector, not being influenced by ship pollution. The ship's RM Young anemometer was located on the starboard side of the ship's mast, 33 meters above the water. The PMEL anemometer and ship anemometer were calibrated in the PMEL wind tunnel in July and October 1995, respectively. The data from the PMEL anemometer were recorded on the PMEL data logger as one minute averages. The data from the ship's RM Young anemometer were recorded on the ship's SCS data system as one minute averages.
The final 30 min average data are reported as (true) wind speed and direction and relative wind speed and direction. The relative wind direction is 0 degrees = wind coming from dead ahead. +90 degrees = wind coming from the the starboard beam, -90 degrees= wind coming from the port beam. The East and North components of the true wind speed are given as WindU and WindV respectively. For this project wind coming from the east is a negative WindU and wind coming from the north is a negative WindV.
Air Temperature and RH were recorded with the the PMEL RM Young sensor, and the PMEL Qualimetrics sensor. The sensors were mounted on top of aerovan forward of the bridge. The data are reported in % (RH) and deg C (AirTemp).
Barometer
The ship’s digital barometer as recorded in the ship’s SCS data record was used for barometric pressure
Precipitation was measured with a Scientific Technology Inc. ORG-100 Optical Precipitation Intensity Sensor. The instrument was mounted on the railing of Aero van and was used along with wind direction, wind speed and CN to control the aerosol chemistry pumps. The dynamic range of the sensor is 0.5 to 1600 mm/h. Spikes in the signal are often associated with sea spray. The 30 minute averaged data include all data points. The data are reported in units of mm/hr.
Total solar radiation was measured with an Epply Black and White Pyranometer (horizontal surface receiver -180(), model 8-48, serial number 12946, and an Epply precision pyranometer (horizontal surface receiver -180(, twin hemispheres), model PSP, serial number 133035F3 that were mounted on the top of AeroVan. The instrument was calibrated by The Eppley Laboratory on October 11, 1994. There were times when the sampling mast shaded the sensor. There were also times when the ship's mast shaded the sensor. These "bad" data due to shading have not been edited out of the 30 minute data record. The data reported in 30 minute averages in units of watts per square meter.
Ozone
Two
ozone uv analyzers were used, a Dasibi 1008 AH ,and a TECO 49. Both
analyzers were calibrated to a NIST traceable analyzer at the
NOAA-CMDL lab prior to the project. One minute averages of the output
of each analyzer were recorded on the PMEL data system and plots were
made of the raw data. A small portion of the data was deleted
(consisting mostly of times that the inlet air was passed through a
zero filter - usually when the relative wind was well behind the beam
of the ship).
Atmospheric radon was measured with a dual-flow-loop two-filter radon detector constructed at PMEL by Stewart Whittlestone (ANSTO). The system was calibrated with a dry radon source (Pylon Electronics Corp. Canada) and intercalibrated with the source used by Stewart Whittlestone. The data are reported in units of mBq per cubic meter.
CN (UFCN) - the total number of particles with diameters > 3nm were measured with a TSI 3025 at the base of the aerosol sampling mast. Missing and polluted data values have been replaced by -999. Units are particles per cubic centimeter.
Light Scattering by particles was measured by a TSI TSI 3-wavelength (450,550,700nm) total and backscatter nephelometer. Two impactors were placed upstream of the nephelometer. One had a nominal size cut of 10 um and the other of 1 um. A valve was switched every 15 minutes by the data logger so that either light scattering of the total aerosol or of the submicron aerosol lignt scattering was measured. Each 30 minute averaging period included has 15 minutes of data for submicron scattering and 15 minutes of data for total (light scattering by all particles). The instrument was calibrated on the cruise using CO2. The scattering values are in units of inverse mega meters.
Ion Chemistry (Ion Chromatograph)
Two and seven-stage multi-jet cascade impactors (Berner et al., 1979) sampling air at 55-60% RH were used to determine the mass size distribution of Cl-, Br-, NO3-, SO4=, Na+, NH4+, K+, Mg+2, and Ca+2. Sampling periods ranged from 12 to 24 hours. In the data record zero indicates “below detection limit”.
Ion concentrations are given in ng/m3. For the two stage impactor samples, Submicron values represent the ion concentration in all particles with aerodynamic diameters < 1.0 um. Supermicron values are for particles with aerodynamic diameters > 1um and < 10 um.
For the seven stage impactor the size cuts are as follows:
Stage |
Dp |
D50, aero |
dlogDp |
1 |
Dp, 1 |
0.182 |
0.358 |
2 |
Dp, 2 |
0.305 |
0.223 |
3 |
Dp, 3 |
0.57 |
0.272 |
4 |
Dp, 4 |
1.1 |
0.286 |
5 |
Dp, 5 |
2.15 |
0.291 |
6 |
Dp, 6 |
4.05 |
0.275 |
7 |
Dp, 7 |
10 |
0.393 |
(These diameters are given for a flow rate of 30 lpm and are subject to change after calibration of the collection efficiency of the impactor jet plate. This calibration is planned for the Fall of 1996).
Particle Size Distributions as dN/dlogDp in 63 diameter bins were measured with ultrafine DMA (D5 -D15.9), TSI DMA (D20 - D571.4) and TSI APS (D835.46 - D13824) at the base of the aerosol sampling mast and are reported as 30 minute averages.
Seawater temperature and salinity:
Seawater temperature and salinity were measured with the ship's thermosalinograph (Seabird SBE-21 serial number 843) and recorded on the ship's SCS system. The instrument was calibrated by the NW regional Calibration Center on 10/11/95. The instantaneous one-minute data set from the ship were very clean and required very little editing. Temperatures are reported in degrees C. Salinity data are in practical salinity units (psu).
Nitrate:
Water from the ship's underway pumping system (5 meter depth, bow intake) was run through the underway autoanalzyer system to measure surface nitrate + nitrite concentrations. The instrument samples at 10 minute intervals: seawater, blank, seawater, blank, standard, blank; repeating this sequence each hour. Data are marked with either a concentration, 0 (indicating below detection limit), or -99 (when there were no data). The lower limit of detection was generally 0.05 micromolar but was as low as 0.02 micromolar at times. All data reported here are in units of micromoles per liter.
Seawater DMS:
Seawater samples were collected from the ship's seawater pumping system at a depth of approximately 5 m and immediately analyzed aboard ship. The seawater line ran to the analytical system where 5.1 ml of sample were valved into a Teflon gas stripper. The samples were purged with hydrogen at 80 ml/min for 5 min. Water vapor in the purged seawater sample stream was removed by passing the flow through a -25C Teflon tube filled with silanized glass wool. DMS was then trapped in a -25C Teflon tube filled with Tenax. During the sample trapping period, 6.2 pmole of methylethyl sulfide were valved into the hyrogen stream as in internal standard. At the end of the sampling/purge period the coolant was pushed away from the trap and the trap was electrically heated. DMS was desorbed onto a DB-1 mega-bore fused silica column where the sulfur compounds were separated isothermally at 50C and quantified with a sulfur chemiluminesence detector. The detection limit during CSP was approximately 0.8 pmole. The system was calibrated using gravimetrically calibrated permeation tubes. The precision of the analysis, based on replicate analyses of a single water sample was typically +- 8%. The performance of the system was monitored regularly by running blanks and standards through the entire system. Values reported here have been corrected for recovery losses. System blanks were below detection limit.
U.S.Dept of Commerce / NOAA / OAR / PMEL / Atmospheric Chemistry